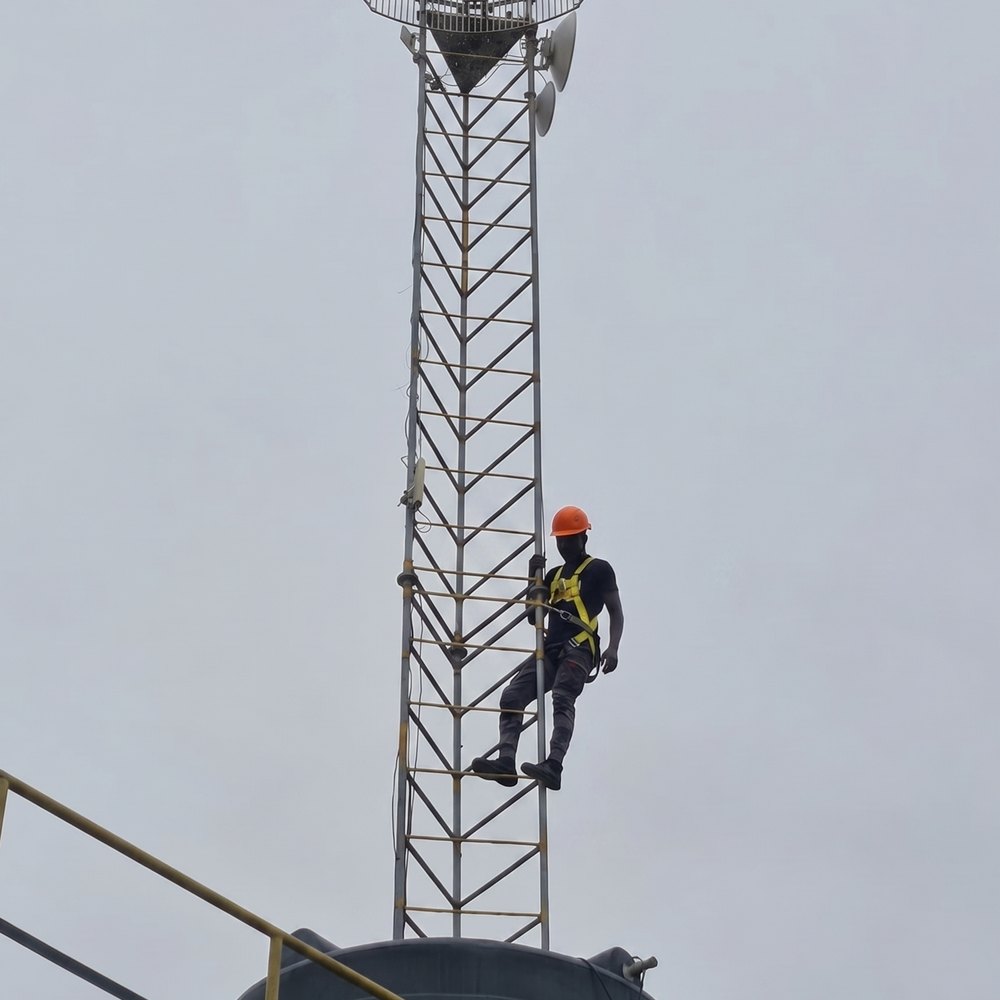
What we do · Water Management
Water Management
Wells, mains and reservoirs reporting between visits, so consumption is a continuous record rather than a monthly reading.
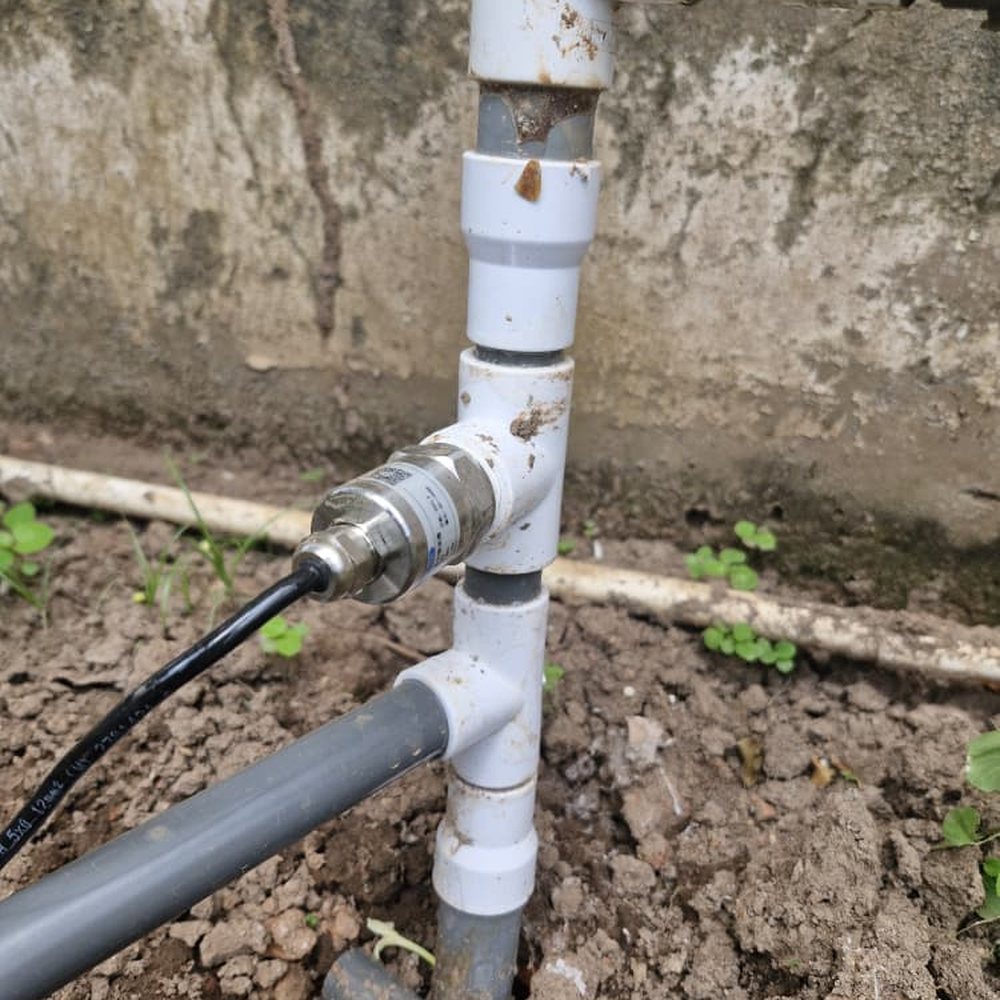
What we measure
9 parameters on this area.
Every reading is timestamped on arrival. Where the link drops, the gateway holds the readings and forwards them when it returns.
What we measure · Water Management
9 parameters · ticks are readings in 15 minutes · orange is event-driven
Parameter
SymbolUnit
Cadence
- 01Water tablehm15 min
- 02Aquifer levelhm15 min
- 03FlowQm³/h1 min
- 04VolumeVm³15 min
- 05Pressurepbar1 min
- 06Pump run hourshh15 min
- 07Electrical parametersU, IV, A1 min
- 08Phase asymmetry—%1 min
- 09Valve position—% openon change
What is fitted is decided at survey. This is the range we specify from, not a list of what every site gets.
Also monitored
The other four areas.
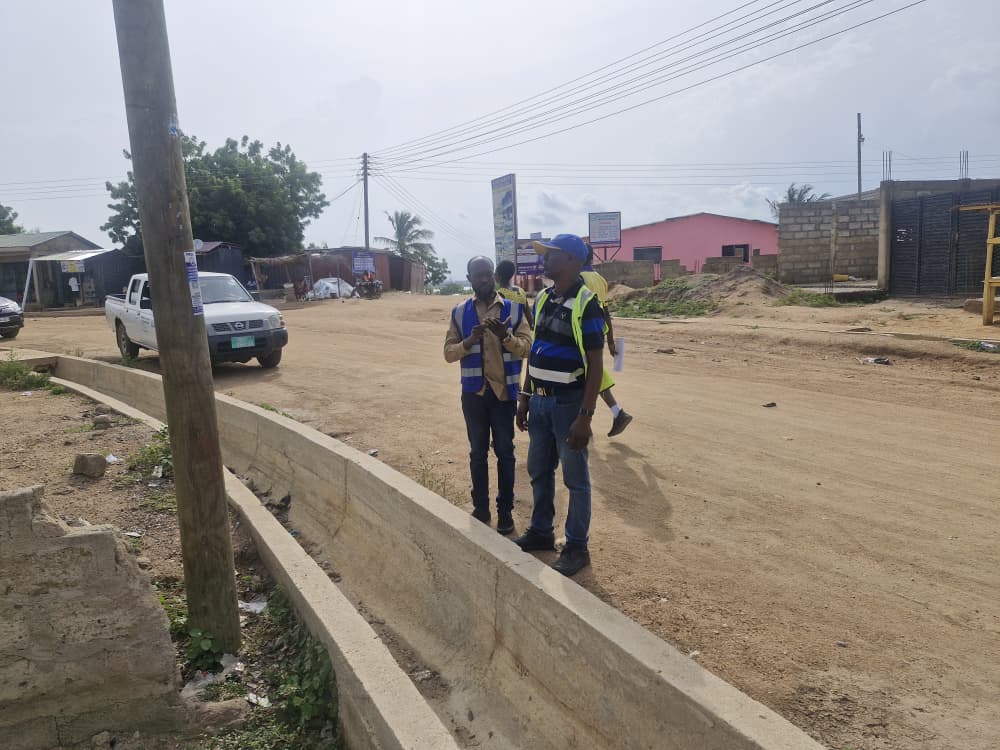 Environment
Air, water and effluent, recorded continuously rather than when someone remembers to take a reading.
11 parameters11 continuous
Open
Environment
Air, water and effluent, recorded continuously rather than when someone remembers to take a reading.
11 parameters11 continuous
Open
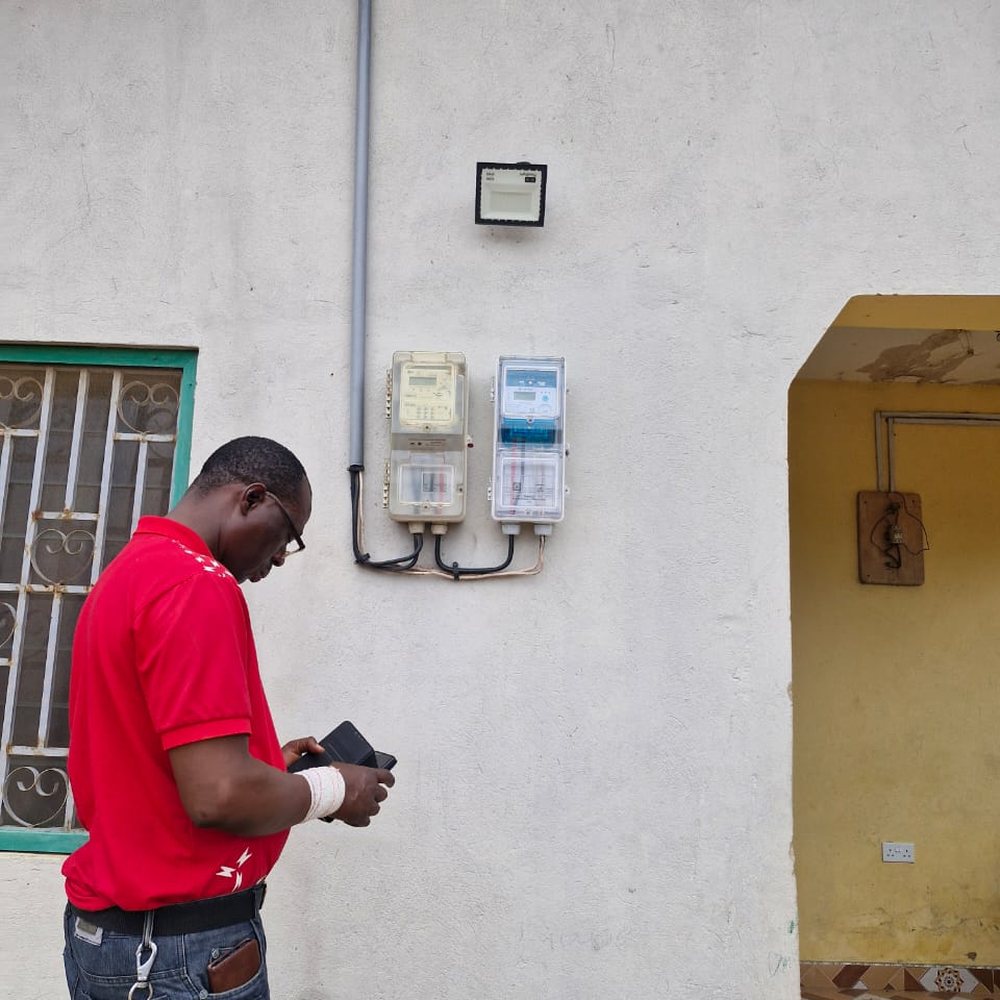 Energy
Generators, street lighting, distribution assets and metering points, reporting state and consumption from wherever they are installed.
10 parameters9 continuous · 1 on event
Open
Energy
Generators, street lighting, distribution assets and metering points, reporting state and consumption from wherever they are installed.
10 parameters9 continuous · 1 on event
Open
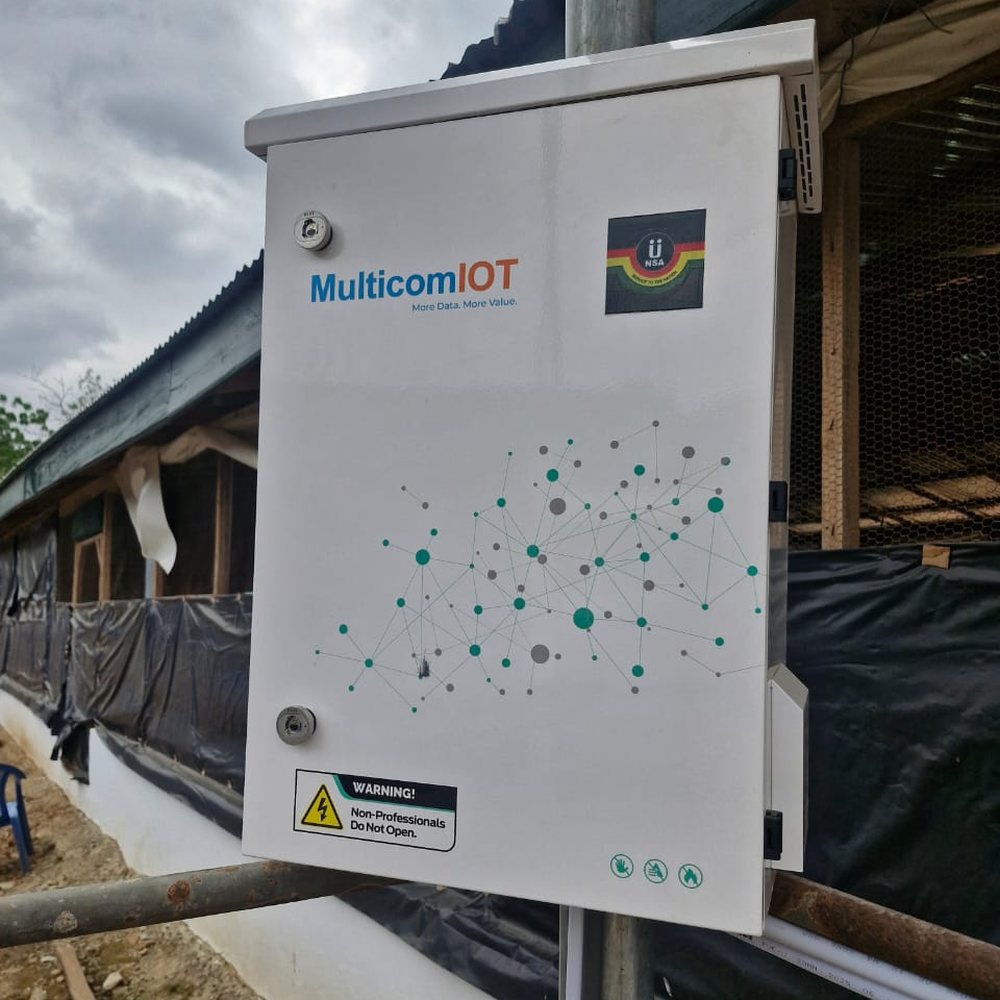 Agriculture
Water, power and climate on land nobody is standing on: tank levels, pump state, gate and store status.
9 parameters7 continuous · 2 on event
Open
Agriculture
Water, power and climate on land nobody is standing on: tank levels, pump state, gate and store status.
9 parameters7 continuous · 2 on event
Open
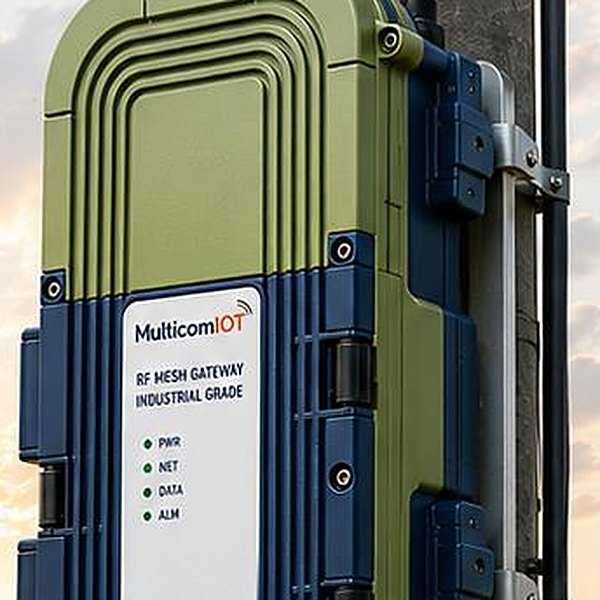 RTUs & Gateways
The box between the site and everything else.
10 parameters5 continuous · 5 on event
Open
RTUs & Gateways
The box between the site and everything else.
10 parameters5 continuous · 5 on event
Open